Server Monitoring
BRIDGEPORT collects server-level metrics (CPU, memory, disk, load, swap, TCP connections, and file descriptors) via SSH polling or a lightweight push agent, stores them as time-series data, and visualizes them in interactive charts.
Quick Start
Section titled “Quick Start”- Navigate to Servers and select a server.
- In the Monitoring card, choose a metrics mode:
- SSH — BRIDGEPORT polls the server over SSH on a schedule.
- Agent — A lightweight Go binary runs on the server and pushes metrics.
- Go to Monitoring > Servers to see your first data points.
How It Works
Section titled “How It Works”sequenceDiagram
participant S as Scheduler
participant BP as BRIDGEPORT
participant SRV as Your Server
participant A as Agent (optional)
participant DB as SQLite
alt SSH Polling Mode
S->>BP: Timer fires (every SCHEDULER_METRICS_INTERVAL)
BP->>SRV: SSH: top, free, df, /proc/loadavg, /proc/uptime
SRV-->>BP: Raw output
BP->>DB: Save ServerMetrics row
end
alt Agent Push Mode
A->>BP: POST /api/metrics/ingest (every ~15s)
Note over A,BP: Server metrics + service metrics<br/>+ containers + top processes<br/>+ TCP/cert checks
BP->>DB: Save ServerMetrics + ServiceMetrics rows
BP->>DB: Upsert AgentContainerSnapshot + AgentProcessSnapshot
end
Collected Metrics
Section titled “Collected Metrics”SSH Mode
Section titled “SSH Mode”The SSH collector runs a series of shell commands in a single SSH session:
| Metric | Command | Fields |
|---|---|---|
| CPU | top -bn1 | cpuPercent |
| Memory | free -m | memoryUsedMb, memoryTotalMb |
| Swap | free -m | swapUsedMb, swapTotalMb |
| Disk | df -BG / | diskUsedGb, diskTotalGb |
| Load | /proc/loadavg | loadAvg1, loadAvg5, loadAvg15 |
| Uptime | /proc/uptime | uptime (seconds) |
Agent Mode (additional data)
Section titled “Agent Mode (additional data)”The agent collects everything SSH mode collects, plus:
| Additional Data | Description |
|---|---|
openFds / maxFds | Open and max file descriptors |
tcpEstablished, tcpListen, tcpTimeWait, tcpCloseWait, tcpTotal | TCP socket breakdown |
| Top processes (by CPU and memory) | PID, name, state, CPU%, memory MB, threads |
| Container snapshots | Full container list with image, state, ports, labels, mounts |
| TCP check results | Agent-performed TCP port connectivity checks |
| Certificate check results | TLS certificate expiry, issuer, subject |
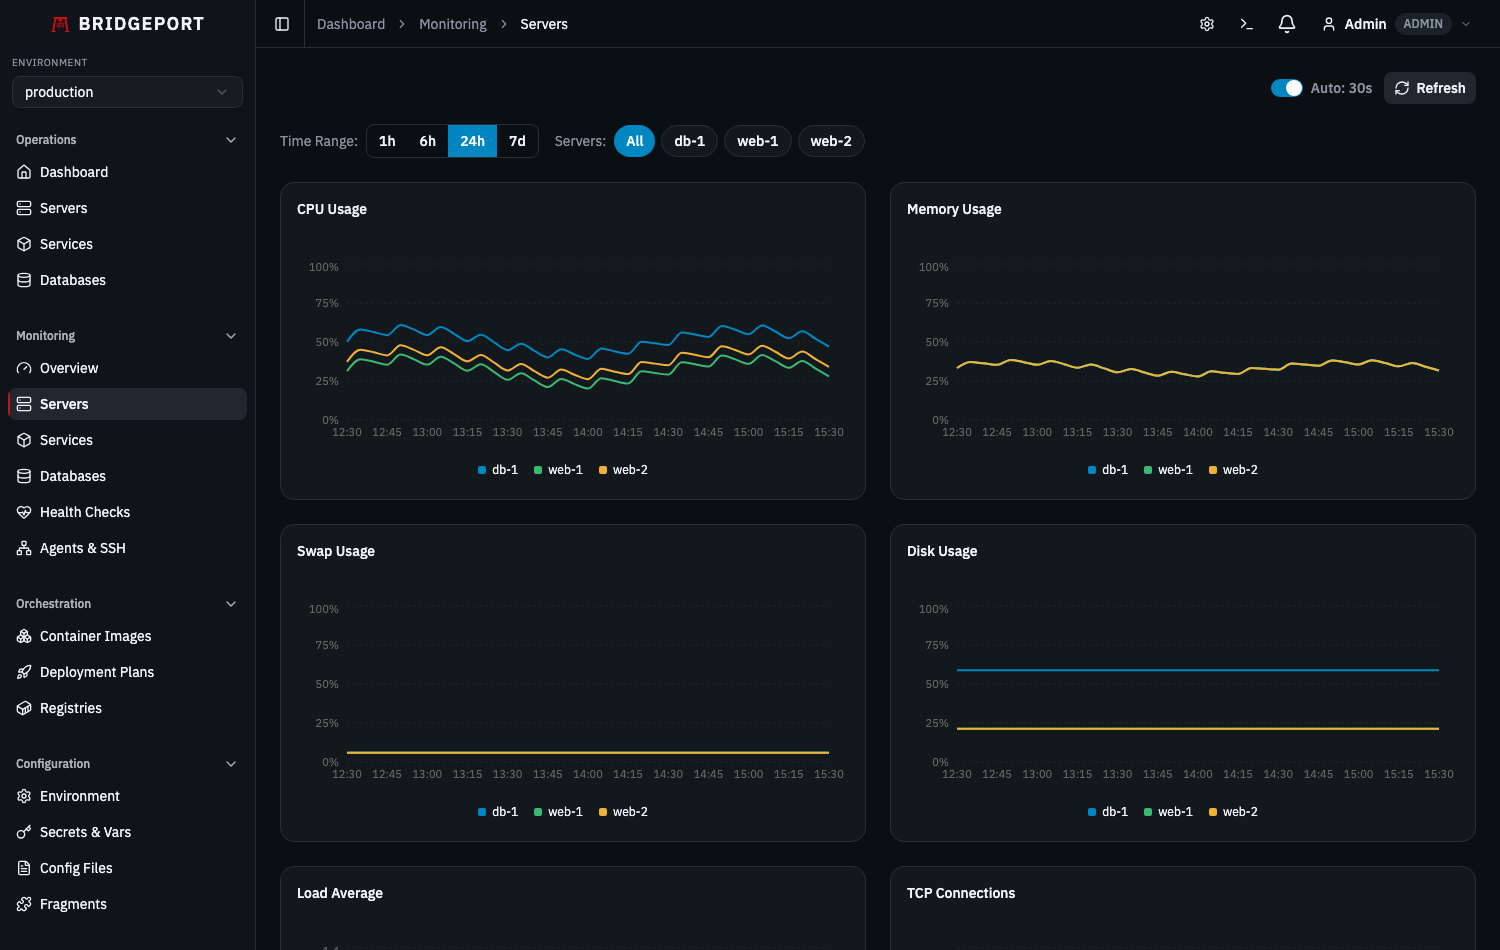
Viewing Charts
Section titled “Viewing Charts”Navigate to Monitoring > Servers (/monitoring/servers).
Available Charts
Section titled “Available Charts”- CPU Usage — Percentage over time
- Memory Usage — Used vs total (MB and percentage)
- Swap Usage — Used vs total (MB and percentage)
- Disk Usage — Used vs total (GB and percentage)
- Load Average — 1, 5, and 15 minute averages
- TCP Connections — Established, listen, time-wait, close-wait, total
- File Descriptors — Open vs max (agent mode only)
Time Range Selection
Section titled “Time Range Selection”Use the time range selector to zoom in or out:
| Range | Data Points |
|---|---|
| 1h | ~12 (SSH) or ~240 (agent) |
| 6h | ~72 (SSH) or ~1440 (agent) |
| 24h | ~288 (SSH) or ~5760 (agent) |
| 7d (max) | ~2016 (SSH) or ~40320 (agent) |
Auto-Refresh
Section titled “Auto-Refresh”Charts auto-refresh every 30 seconds. Toggle auto-refresh on or off with the checkbox in the top-right corner.
Agent Details
Section titled “Agent Details”How the Agent Gets Deployed
Section titled “How the Agent Gets Deployed”When you set a server’s metrics mode to agent:
- BRIDGEPORT generates a unique agent token for the server.
- BRIDGEPORT SSHs into the server and deploys the agent binary.
- The agent starts pushing to
POST /api/metrics/ingestusing the token. - The server’s
agentStatustransitions fromwaitingtoactive.
Agent Status Lifecycle
Section titled “Agent Status Lifecycle”stateDiagram-v2
[*] --> waiting: Agent token created
waiting --> deploying: SSH deploy starts
deploying --> waiting: Deploy complete
waiting --> active: First metrics push
active --> stale: No push for staleThreshold
stale --> offline: No push for offlineThreshold
stale --> active: Push received
offline --> active: Push received
- active — Agent is pushing metrics regularly.
- stale — No push received within the stale threshold (configurable in System Settings).
- offline — No push received within the offline threshold. A
system.server_offlinenotification is sent.
Regenerating Agent Tokens
Section titled “Regenerating Agent Tokens”If you need to rotate the agent token:
- Go to Monitoring > Agents & SSH.
- Click Regenerate Token on the server.
- BRIDGEPORT generates a new token and redeploys the agent automatically.
Agent Upgrade Indicators
Section titled “Agent Upgrade Indicators”The server detail page and the Monitoring > Agents page show an “Update available” badge when the deployed agent version differs from the bundled version in BRIDGEPORT.
Collection Intervals
Section titled “Collection Intervals”Global Defaults (Environment Variables)
Section titled “Global Defaults (Environment Variables)”Set in your environment or .env file:
| Variable | Default | Description |
|---|---|---|
SCHEDULER_METRICS_INTERVAL | 300 (5 min) | SSH metrics collection interval (seconds) |
SCHEDULER_SERVER_HEALTH_INTERVAL | 60 (1 min) | Server health check interval (seconds) |
Collection Intervals (Global)
Section titled “Collection Intervals (Global)”Collection cadence is global, set by env vars (not per-environment) — see Configuration Reference → Scheduler:
| Env var | Default | Description |
|---|---|---|
SCHEDULER_METRICS_INTERVAL | 300 (5 min) | How often SSH metrics are collected |
SCHEDULER_SERVER_HEALTH_INTERVAL | 60 (1 min) | How often server health is checked |
Metric Toggles
Section titled “Metric Toggles”Per-environment metric toggles let you disable collection of specific metric types. All are enabled by default. Configure in Settings > Monitoring:
| Toggle | Controls |
|---|---|
collectCpu | CPU percentage |
collectMemory | Memory usage |
collectSwap | Swap usage |
collectDisk | Disk usage |
collectLoad | Load averages |
collectFds | File descriptors |
collectTcp | TCP socket counts |
collectProcesses | Top processes (agent only) |
collectTcpChecks | TCP port checks (agent only) |
collectCertChecks | TLS certificate checks (agent only) |
Retention
Section titled “Retention”Metrics are automatically cleaned up based on retention settings:
| Setting | Default | Scope |
|---|---|---|
METRICS_RETENTION_DAYS | 7 | Global env var (see Configuration Reference) |
| Cleanup cadence | Hourly | Global (scheduler runs cleanup every hour) |
Old ServerMetrics and ServiceMetrics rows older than the retention period are deleted automatically.
Troubleshooting
Section titled “Troubleshooting”No metrics appearing (SSH mode)
Section titled “No metrics appearing (SSH mode)”- Verify SSH connectivity: Go to Monitoring > Agents & SSH and click Test SSH for the server.
- Check metrics mode: Ensure the server is set to
sshmode, notdisabled. - Check scheduler: Verify
SCHEDULER_ENABLED=truein your environment. - Check SSH user: The SSH user must have permission to run
top,free,df, and read/proc/.
No metrics appearing (Agent mode)
Section titled “No metrics appearing (Agent mode)”- Check agent status: Go to Monitoring > Agents & SSH. The agent should show
active. - If status is
waiting: The agent may not have connected yet. Check the server’s Docker logs or system journal. - If status is
offline: The agent stopped pushing. SSH into the server and check if the agent process is running. - Check firewall: The agent needs outbound HTTPS access to your BRIDGEPORT instance.
- Regenerate token: If the token is compromised or lost, use Regenerate Token to redeploy.
Stale or missing data points
Section titled “Stale or missing data points”- Check the Metrics Mode is not
disabled. - Verify the scheduler is running (check BRIDGEPORT container logs for
[Scheduler]messages). - For SSH mode, large collection intervals mean fewer data points. Decrease
SCHEDULER_METRICS_INTERVALfor more granularity.
Charts show flat lines
Section titled “Charts show flat lines”This typically means the metric value is genuinely stable. Check the Y-axis scale — it may be zoomed in to a narrow range.
Related
Section titled “Related”- Monitoring Quick Start — Decision tree for choosing your monitoring mode
- Service Monitoring — Container-level metrics
- Database Monitoring — Plugin-driven database metrics
- Health Checks — Health check system and scheduling
- Notifications — Get alerted on server offline/recovery events
- Servers Guide — Server setup and configuration